8.1 KiB
Spectrum markers management
The spectrum markers are controlled with this dialog. Note that spectrum markers will effectively show on the spectrum display only when it is active (shows some data).
General interface
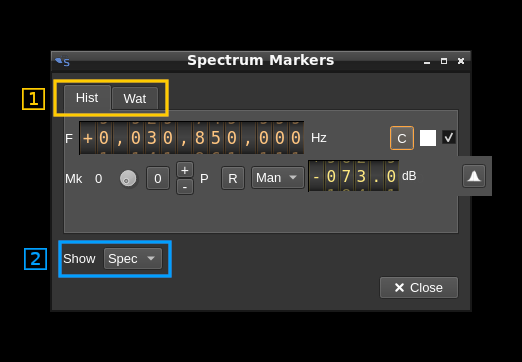
1. Sub-dialog selection
The complete dialog is split into tabs:
- Hist for histogram (spectrum line) markers
- Wat for waterfall markers
- Anno for annotation markers
2. Markers set selection
This lets you selects which markers are displayed
- None: no markers are displayed
- Spec: spectrum markers (histogram and waterfall) are displayed
- Anno: spectrum annotations are displayed
- All: both markers and annotations are displayed
Histogram markers tab
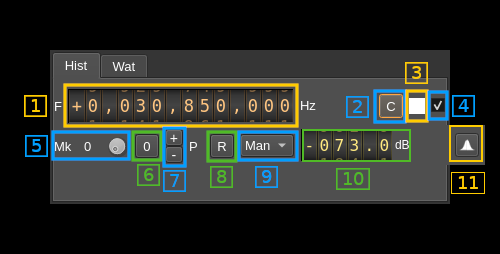
1. Marker frequency
Use this frequency dial to set the marker frequency in Hz
2. Center marker frequency
Push this button to move the marker at the center of the current spectrum
3. Marker color
The marker color is displayed here. You can click on the square to open a standard color selection dialog to select the marker color. Note that it selects the color of the text display of the marker the crosshairs remain in white color.
4. Marker show
Toggles marker display on the spectrum
5. Marker selection
Turn the dial button to select the marker being set up. The index of the marker appears at left.
6. Swap marker with reference marker (index 0)
Push this button to swap the current marker with marker at index 0. The marker at index 0 is the reference marker. Note that the colors are not swapped so that the marker color is associated to its index and not the marker itself.
7. Add/Remove marker
- Press the "+" button to add a new marker with a maximum of 4 markers.
- Press the "-" button to remove the current marker. When reference marker (index 0) is removed the marker at index 1 if it exists replaces it and thus is made the reference marker.
8. Power hold reset
When the power max hold is selected (9) this button resets the max hold
9. Marker type
This combo lets you select the type of marker:
- Man: manual power set. The value is set with the next control (10)
- Cur: current power. The marker will move according to the current power at the marker frequency
- Max: max hold. The marker will move according to the maximum power at the marker frequency. Use button (8) to reset.
10. Manual (fixed) power
Use this slider to adjust the power position of the marker. The units are in dB irrespective of the linear or log set of the spectrum display.
11. Peak detection
Activates or de-activates peak detection. With peak detection engaged markers with type "Cur" or "Max" will be automatically set to frequency (bin) of maximum power. The first marker in index order with "Cur" or "Max" will be set to the highest peak in magnitude then next marker to next peak in magnitude order etc,,, Markers of type "Cur" will track current peaks and markers of type "Max" will track peak maxima making it more suitable for transient signals.
Waterfall markers tab
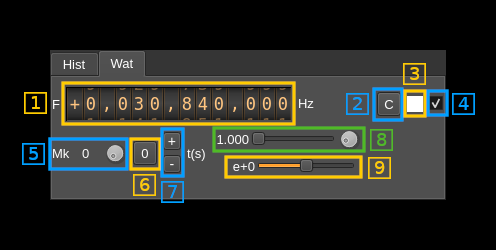
1. Marker frequency
Use this frequency dial to set the marker frequency in Hz
2. Center marker frequency
Push this button to move the marker at the center of the spectrum
3. Marker color
The marker color is displayed here. You can click on the square to open a standard color selection dialog to select the marker color. Note that it selects the color of the text display of the marker the crosshairs remain in white color.
4. Marker show
Toggles marker display on the spectrum
5. Marker selection
Turn the dial button to select the marker being set up. The index of the marker appears at left.
6. Swap marker with reference marker (index 0)
Push this button to swap the current marker with marker at index 0. The marker at index 0 is the reference marker. Note that the colors are not swapped so that the marker color is associated to its index and not the marker itself.
7. Add/Remove marker
- Press the "+" button to add a new marker with a maximum of 4 markers.
- Press the "-" button to remove the current marker. When reference marker (index 0) is removed the marker at index 1 if it exists replaces it and thus is made the reference marker.
8. Time mantissa
The time mark of the marker is given in seconds by mantissa M and exponent E so that t(s) = M × 10E. This part controls the mantissa component M that appears on the left. The slider lets you control the decimal part from .000 to .999 and the dial button the integer part from 0 to 9.
9. Time exponent
This slider lets you control the exponent part E of the time mark so that t(s) = M × 10E. The value in exponential notation appears on the left.
Annotation markers tab
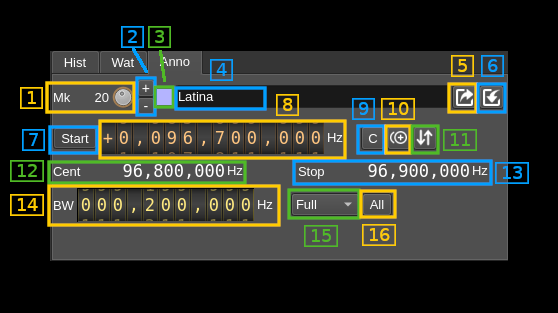
1. Marker selection
Turn the dial button to select the marker being set up. The index of the marker appears at left.
2. Add/Remove marker
- Press the "+" button to add a new marker.
- Press the "-" button to remove the current marker.
3. Marker color
The marker color is displayed here. You can click on the square to open a standard color selection dialog to select the marker color. Note that it selects the color of the text display of the marker the crosshairs remain in white color.
4. Marker text
Type in the text of the marker to be displayed when it is selected (see "Annotations on spectrum display" next). You can enter up to 36 characters.
5. Export markers to .csv file
Export the markers to a .csv file. Columns are
- Start: start frequency in Hz
- Width: width in Hz
- Text: marker text when selected
- Show: marker show state (see 15)
- 0: hidden
- 1: top area or line
- 2: full display
- Red: red component (0..255) of marker color
- Green: green component (0..255) of marker color
- Blue: blue component (0..255) of marker color
The column names appear in the first line (header) of the file
6. Import markers from .csv file
Import the markers from a .csv file in the format described above.
7. Select start or Center input frequency
Use this button to select whether the input frequency next (9) should apply to marker start or center frequency
8. Input marker frequency
Enter either start or center marker frequency in Hz depending on the Start/Center button selection (8)
9. Select central frequency display
Click on this button to set the input frequency (9) to the center frequency of the spectrum
10. Duplicate marker
Duplicate the current marker in a new marker
11. Sort markers
Sort markers by increasing starting frequency
12. Show start/center frequency
The start of center frequency in Hz is displayed when the center or start input frequency (8) is selected respectively.
13. Show stop frequency
Displays the stop frequency of the marker in Hz
14. Marker bandwidth
Sets the bandwidth of the marker in Hz
15. Marker show state
Select how the marker is displayed
- Hidden: marker is hidden
- Top: only the top area or line is displayed
- Full: marker is displayed in full with line limits and text
- Text: top area with text is displayed
16: Apply show state to all
Click on this button to apply the current marker show state (15) to all markers
Annotations on spectrum display
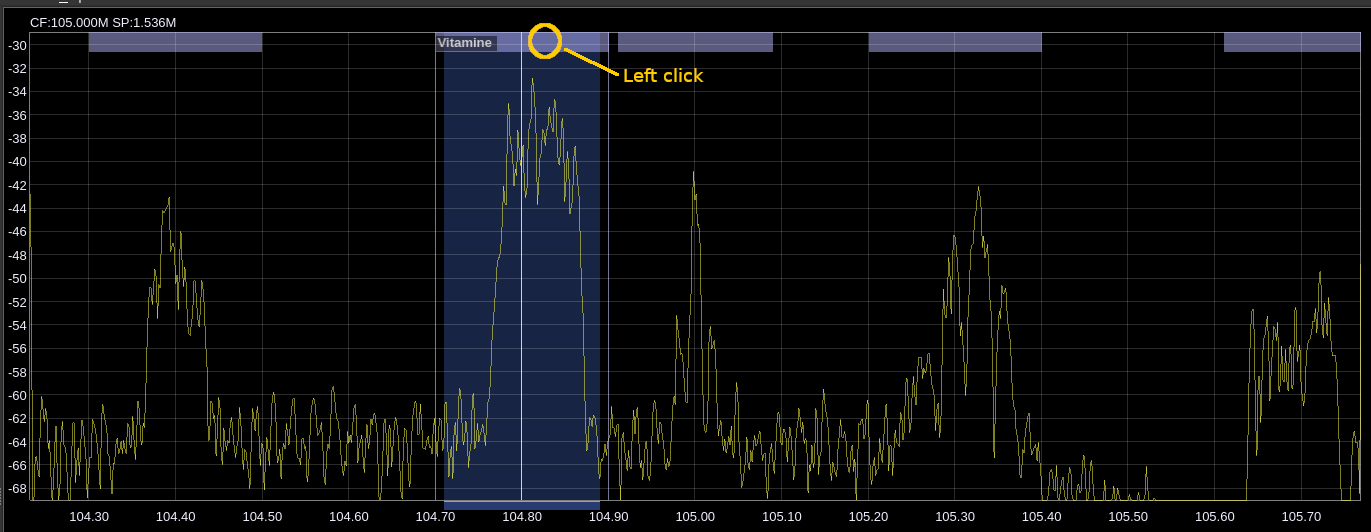
In "top" state the markers are displayed as short lines or thin areas on the top of the spectrum. Click in the marker area to toggle between "full" and "top" states. For line markers (bandwidth 0 Hz) click close to the right of line marker.