|
|
||
|---|---|---|
| build | ||
| config | ||
| docs | ||
| examples | ||
| src | ||
| static | ||
| .babelrc | ||
| .editorconfig | ||
| .gitignore | ||
| .postcssrc.js | ||
| LICENSE | ||
| README.md | ||
| index.html | ||
| package-lock.json | ||
| package.json | ||
README.md
Description
Web Based implementation of SquiggleDraw algorithm, originally implemented by Gregg Wygonik.
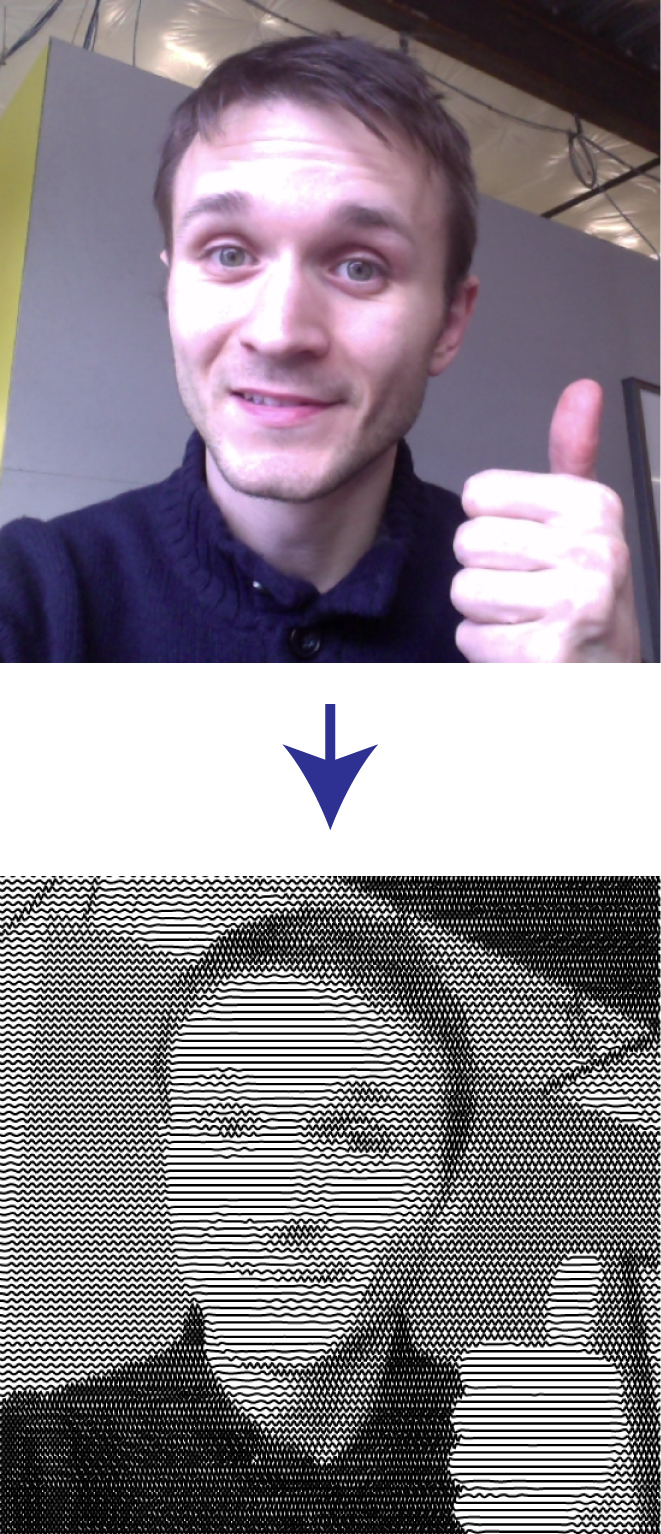
The online version of this project takes a picture from your webcam and turns it into plotter-drawable, laser-engravable SVG file.
Here's an example of output image generated with this tool:
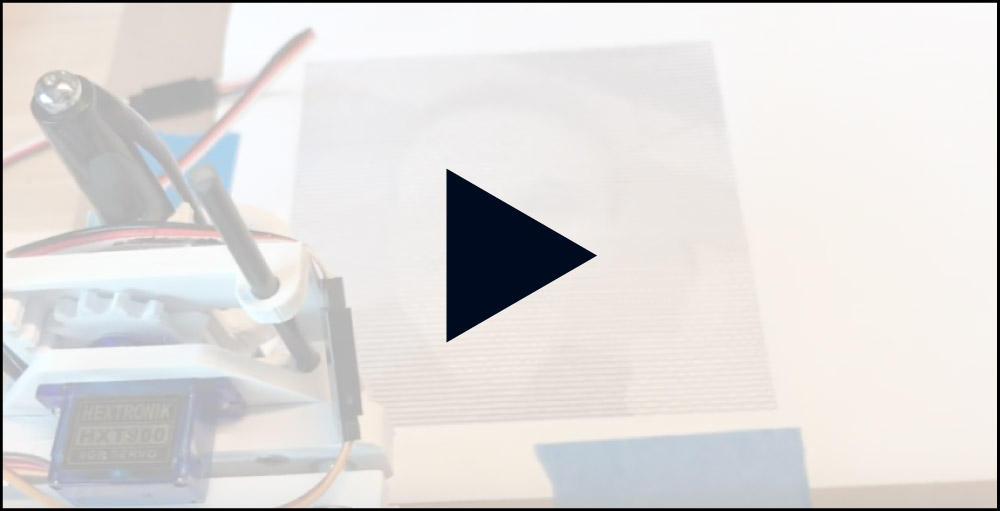
And here's a video my plotter that uses this tool:
Installation and running
Clone or download this repo, then run this command to get all dependencies installed locally:
npm install
Then, run this command to watch for changes and to launch the HTML page in the browser:
npm run dev
Algorithm
The algorithm processes the image in the following way:
Retrieve photo as an array of pixels IMAGE
Set desired number of horizontal lines as LINE_COUNT
Set desired number of vertical spacing as SPACING
Set desired line amplitude as AMPLITUDE
Set desired line rotation frequency as FREQUENCY
For y :=0 to image height step image height / LINE_COUNT do
	Set startx := 0
	Set starty := y
	Create a set of coordinates as [startx, starty]
	For x := 1 to image width step SPACING do
		Get brightness br of the current pixel as average of r,g,b values
		Set r := (255 - br) / LINE_COUNT * AMPLITUDE
		Set a := (255 - br) / FREQUENCY
		Create a set of coordinates as [x, y + Math.sin(a) * r]
Pass the resulting array of coordinates to rendering application
Using the output images
The output SVG file generated with this tool can be uploaded to SVG -> GCODE (or similar) converter in order to be plotted on a pen plotter or engraved on a laser cutter.
Roadmap and todo list
- Ability to use image URL for input
- Ability to save settings in local storage as presets (and reuse them later)
- Ability to switch the squiggle mode (not just horizontal lines): spirals, vertical lines, loops, etc
- Ability to go back to the previous images from your current "session"
- Fix bug with the video size when the paper size is modified during video being on
If you want to implement any of these or contribute - please create an issue and feel free to submit a PR, I would appreciate that.
License
MIT license

