|
|
||
|---|---|---|
| .. | ||
| elasticsearch/config | ||
| filebeat | ||
| kibana/config | ||
| .gitignore | ||
| README.md | ||
| data-sandbox.zip | ||
| docker-compose-full-stack.yml | ||
| docker-compose-sandbox.yml | ||
| kibana-dashboard.png | ||
| kibana-index-creation-step-1.png | ||
| kibana-index-creation-step-2.png | ||
| nginx-page.png | ||
README.md
Run kibana and elasticsearch, sending data coming from nginx logs
Setup
- Run
git clone https://github.com/Ovski4/tutorials.git
cd docker-elk
- Create the data volume with the right permissions:
docker-compose -f docker-compose-full-stack.yml run elasticsearch chown elasticsearch -R /usr/share/elasticsearch/data
- Launch all containers:
docker-compose -f docker-compose-full-stack.yml up -d
-
Browse
http://localhost:5601/. You might have to wait a few minutes while Kibana set things up. You can then click on 'Explore on my own'. -
Then browse
http://localhost:8085/. You should see this page :
The http request will trigger some logs to be send to elasticsearch.
- Come back to kibana at
http://localhost:5601/. In the left panel, click on Discover under the Kibana section and create a new index pattern. You should see the filebeat index appearing in the select box. In the Index pattern name text field, type filebeat-*
- In the following page, select
@timestampand clickCreate index pattern.
Go to the discover page at http://localhost:5601/app/discover#/.
That's it, you should see some data. You might have to update the dates filter located on the top right of the page if nothing shows up.
You can now create visualizations with Kibana.
Follow the next instructions to have a look at a kibana dashboard and some visualizations.
Run kibana and elasticsearch with existing data
This quick setup can be very useful as a sandbox. It comes with data fetched from my personal blog.
Setup
Stop the containers from the first part if needed :
docker-compose -f docker-compose-full-stack.yml down
Extract the data in the volume to bind:
unzip data-sandbox.zip -d ./elasticsearch/
Launch the containers:
docker-compose -f docker-compose-sandbox.yml up -d
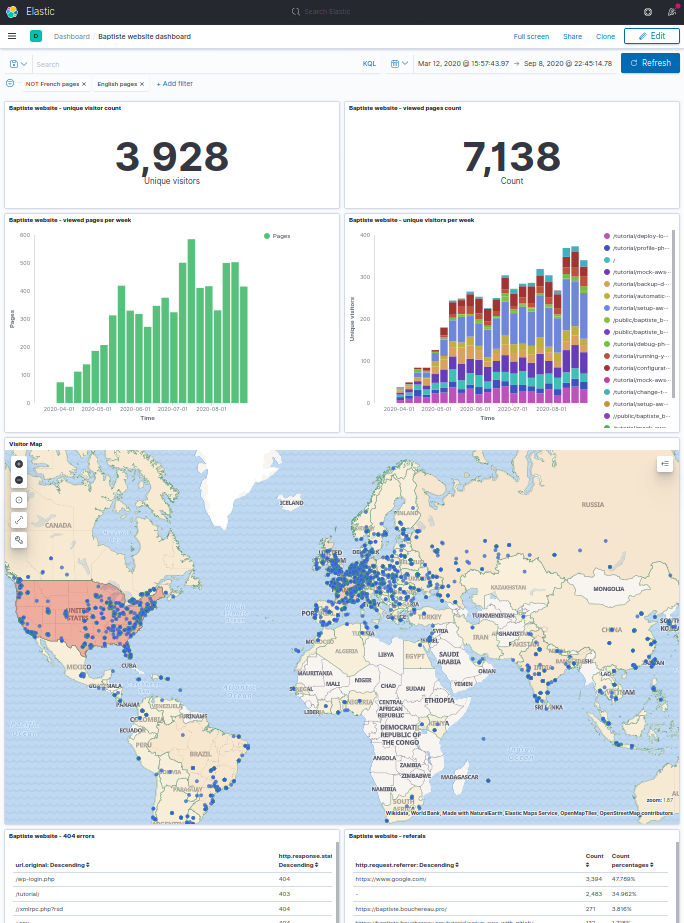
Browse http://localhost:5601/, have look at the dashboard at http://localhost:5601/app/kibana#/dashboards.


